Optimizing Node.js: Identifying and Fixing Performance Problems with Clinic

Software Engineer.
Focused on Node.js and JavaScript.
Here to share my learnings and to learn something new.
Effective tooling is born from a clear intention. If we’re talking about profiling in Node.js, Clinic was intentionally designed to profile Node.js apps.
The experience is completely different from DevtTools. While the developer tools provide a wealth of information, it is not always presented in a comprehensible way, and it is not always clear where to start.
In this article, you’ll learn how to use Clinic to profile Node.js applications, focusing on three common problems during development: high CPU consumption, memory leaks, and unoptimized asynchronous operations.
Setup
To see profiling in action, we need some code. For this purpose, I created a GitHub repository with all the basic scenarios we run into during day-to-day development.
The repository contains an application that starts an HTTP server with three routes. Each route has one specific problem.
In this particular setup, those problems are:
CPU-intensive task, which blocks the main thread.
Asynchronous operation with a waterfall problem (the execution goes one by one instead of parallel).
Memory leak.
Each route has two implementations. One contains a problem that we should be able to spot with the DevTools, and the other is an optimized version with the same functionality.
Profiling
Clinic is a dedicated profiling tool for Node.js, designed with a single goal in mind: to provide the best developer experience (DX) possible when profiling Node.js applications.
To start using Clinic, follow the getting started guide. Install it locally in your project with:
npm install clinic
Or, if you prefer to use Clinic from the CLI, install it globally:
npm install -g clinic
Clinic offers 4 profiling tools:
Doctor: Provides a high-level overview of the application and its processes.
Bubbleproof: Troubleshoots asynchronous issues.
Flame: Visualizes CPU usage with flame graphs.
Heap Profiler: Identifies memory leaks.
We’ll use all four to discover three different types of problems.
CPU-intensive endpoint
We start with the CPU-intensive endpoint. Here are the implementations:
Solution with high CPU consumption
function runCpuIntensiveTask(cb) {
 function fibonacciRecursive(n) {
   if (n <= 1) {
     return n;
   }
   return fibonacciRecursive(n - 1) + fibonacciRecursive(n - 2);
 }

 fibonacciRecursive(45);
 cb();
}
Solution with low CPU consumption
function runSmartCpuIntensiveTask(cb) {
 function fibonacciIterative(n) {
   if (n <= 1) {
     return n;
   }

   let prev = 0, curr = 1;

   for (let i = 2; i <= n; i++) {
     const next = prev + curr;
     prev = curr;
     curr = next;
   }

   return curr;
 }

 fibonacciIterative(45)
 cb();
}
Both versions calculate the 45th Fibonacci number. The first implementation uses a recursive, CPU-intensive approach, while the second one employs an iterative, more efficient approach.
The best way to start a profiling session with Clinic is to use Doctor. Doctor provides an overview of the application and its processes and can redirect you to more specific tools like Bubbleproof if needed.
Here’s how to use Doctor for profiling:
clinic doctor – node app.js
This command starts a Node.js application from the specified file (in this case, app.js). It behaves like a regular application with one exception: Doctor monitors the application and related resources.
You’ll see a similar message in the console:
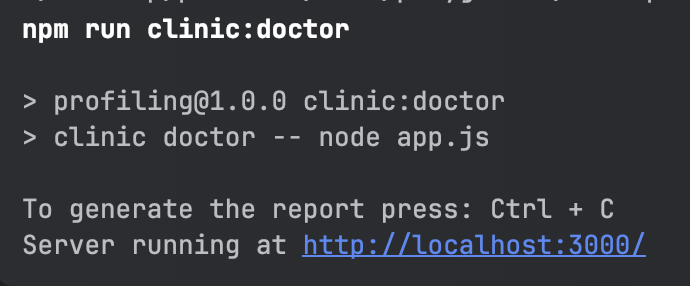
Notice that in order to generate the final profiling report, you have to terminate the running process.
After calling the CPU-intensive endpoint, terminate the process. There will be a dashboard similar to this one.
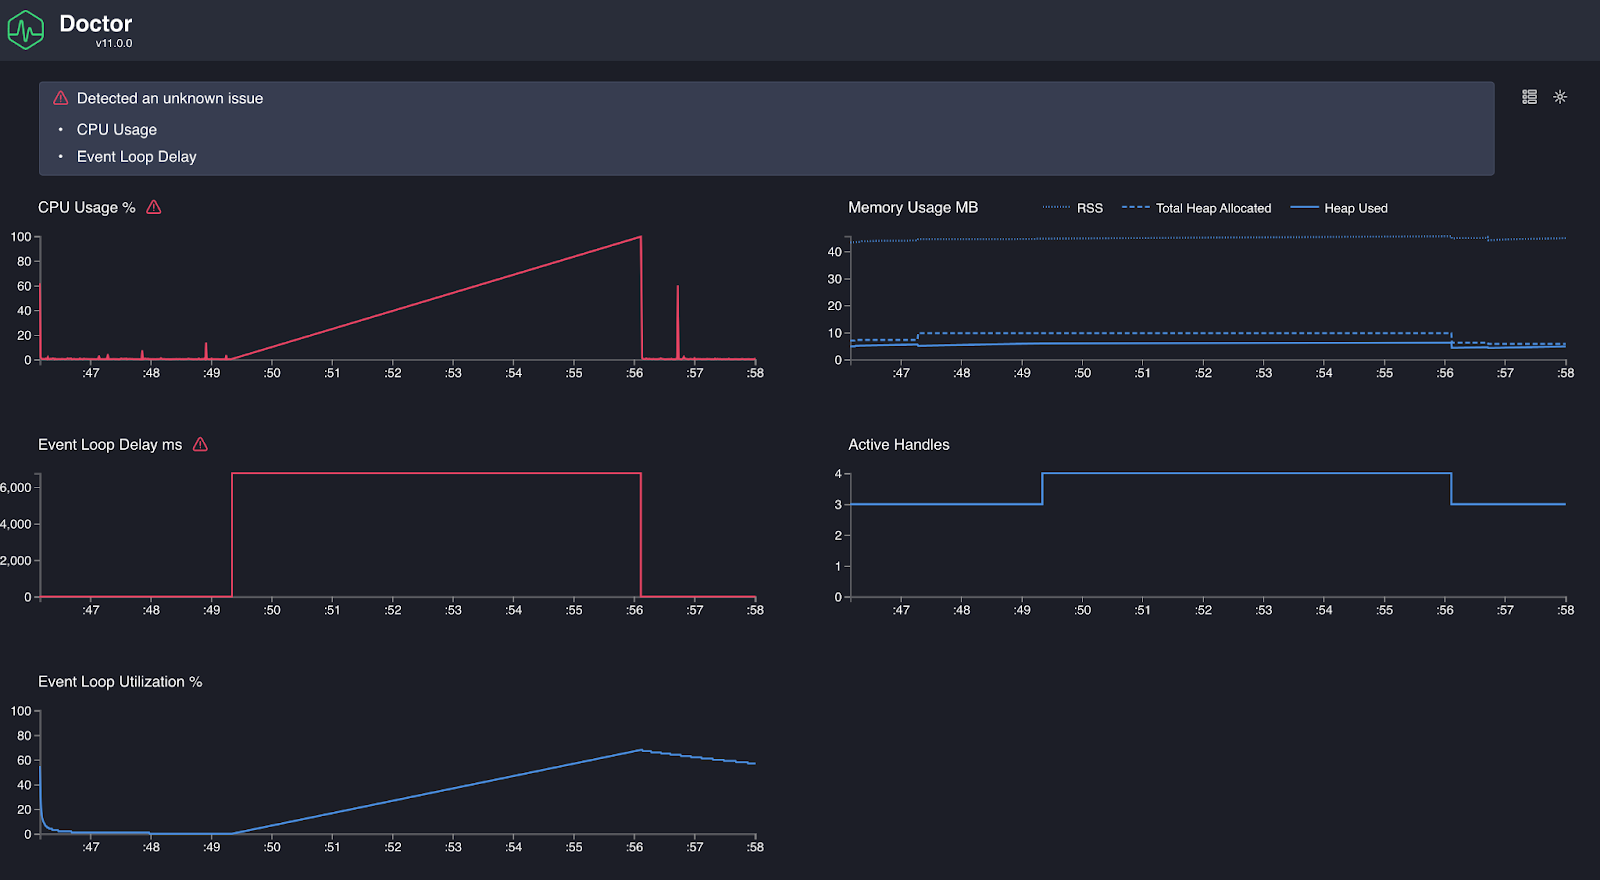
It contains an alert at the very top of the page.
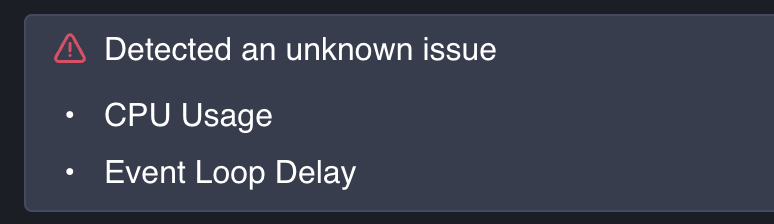
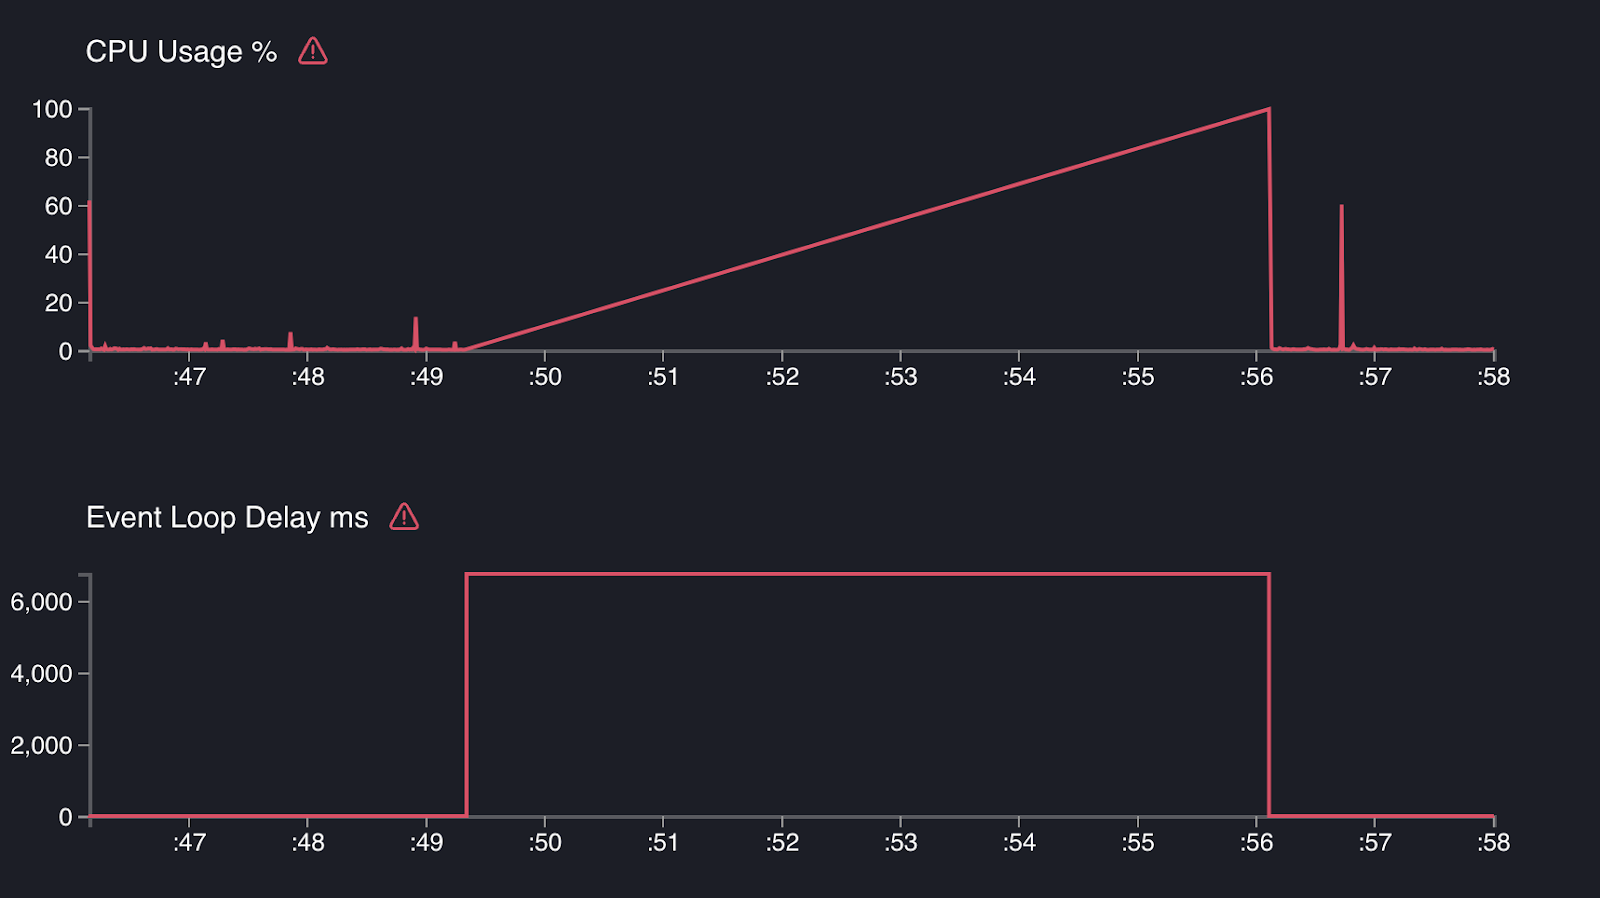
This message clearly shows that we have problems with the CPU and event loop. Indeed, the charts related to these two resources indicate exactly the same thing.
At the very bottom, there is a recommendations section. You can click on it to see detailed, human-readable recommendations on what this problem is about and what you can do next.
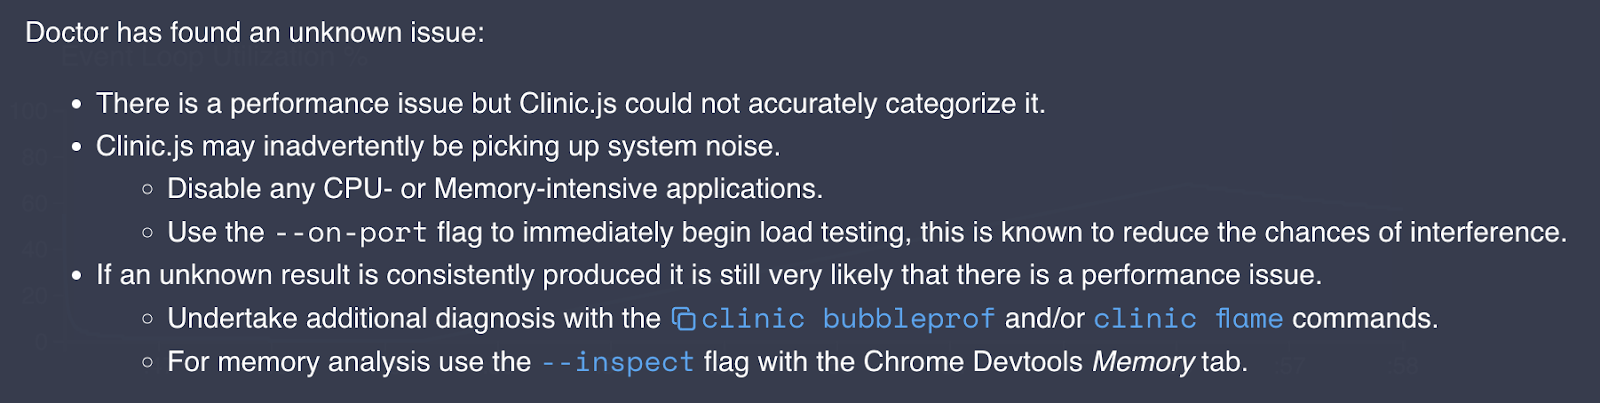
Doctor says there are some CPU-related problems. It also redirects you to Flame or Bubbleprof tools for further analysis. Let’s do as Doctor suggests and use Falme.
clinic flame – node app.js
Sending a request to the same CPU endpoint and terminating the process generates the flame graph.
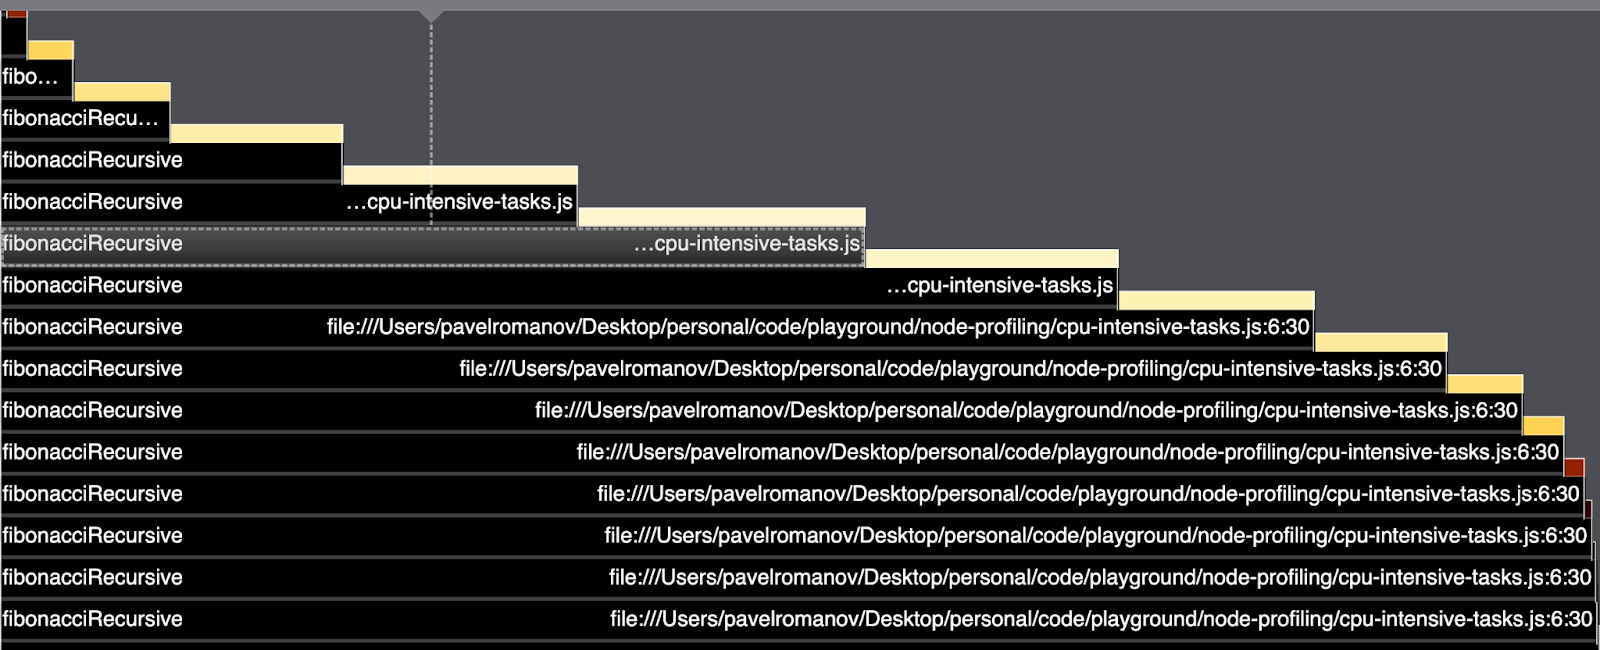
From this graph, it is evident that fibonnaciRecursive takes the most time.
After changing the endpoint implementation to a more effective one, we run the same Flame tool again. The results are drastically different.
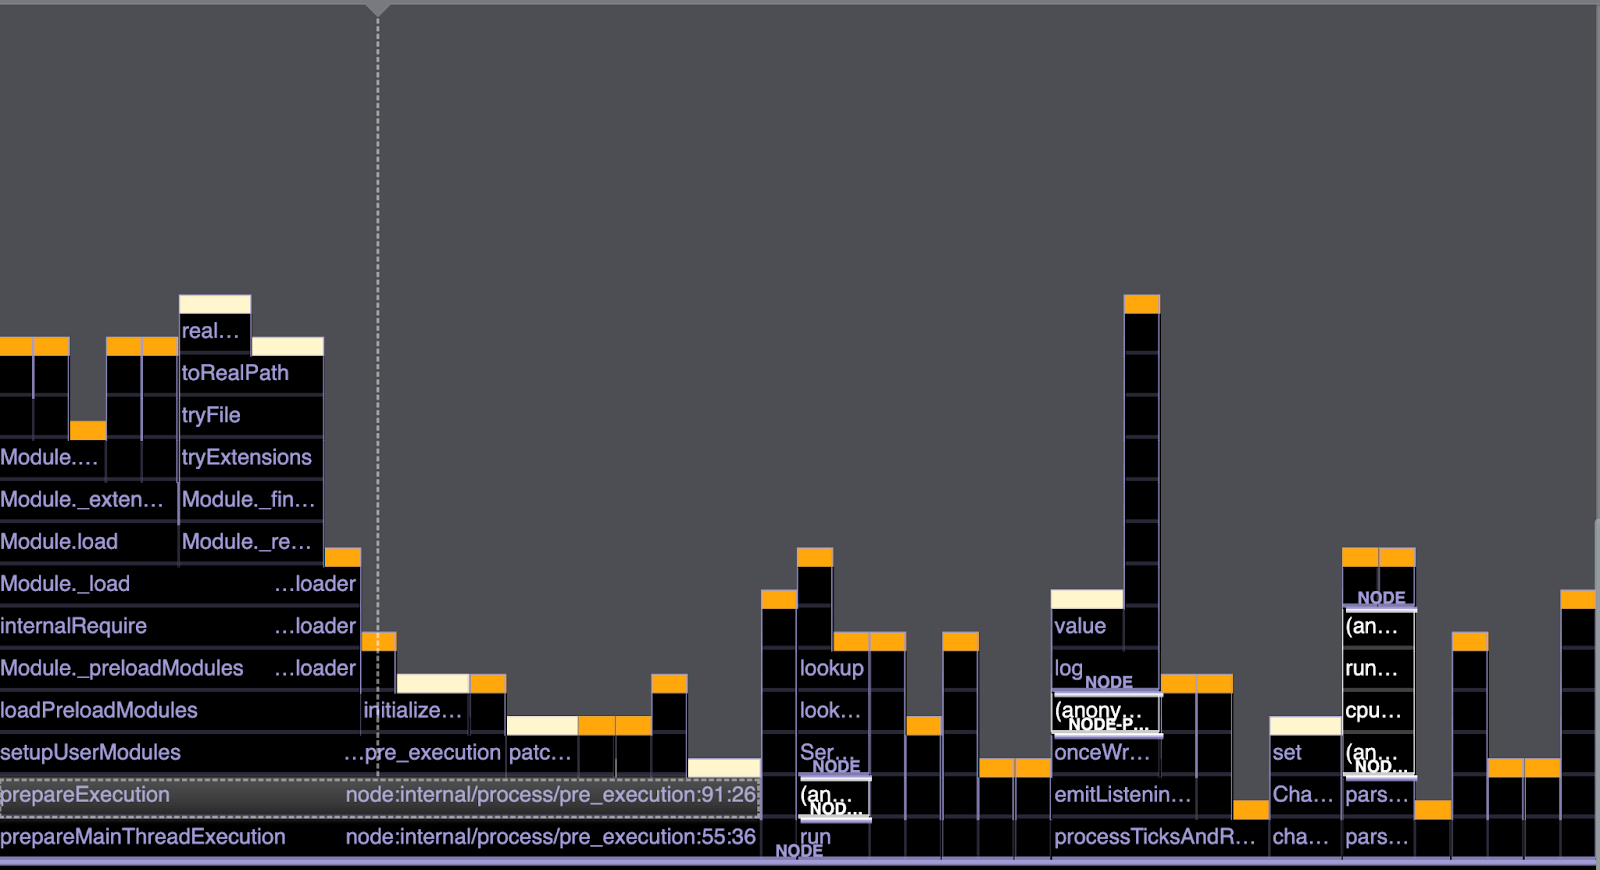
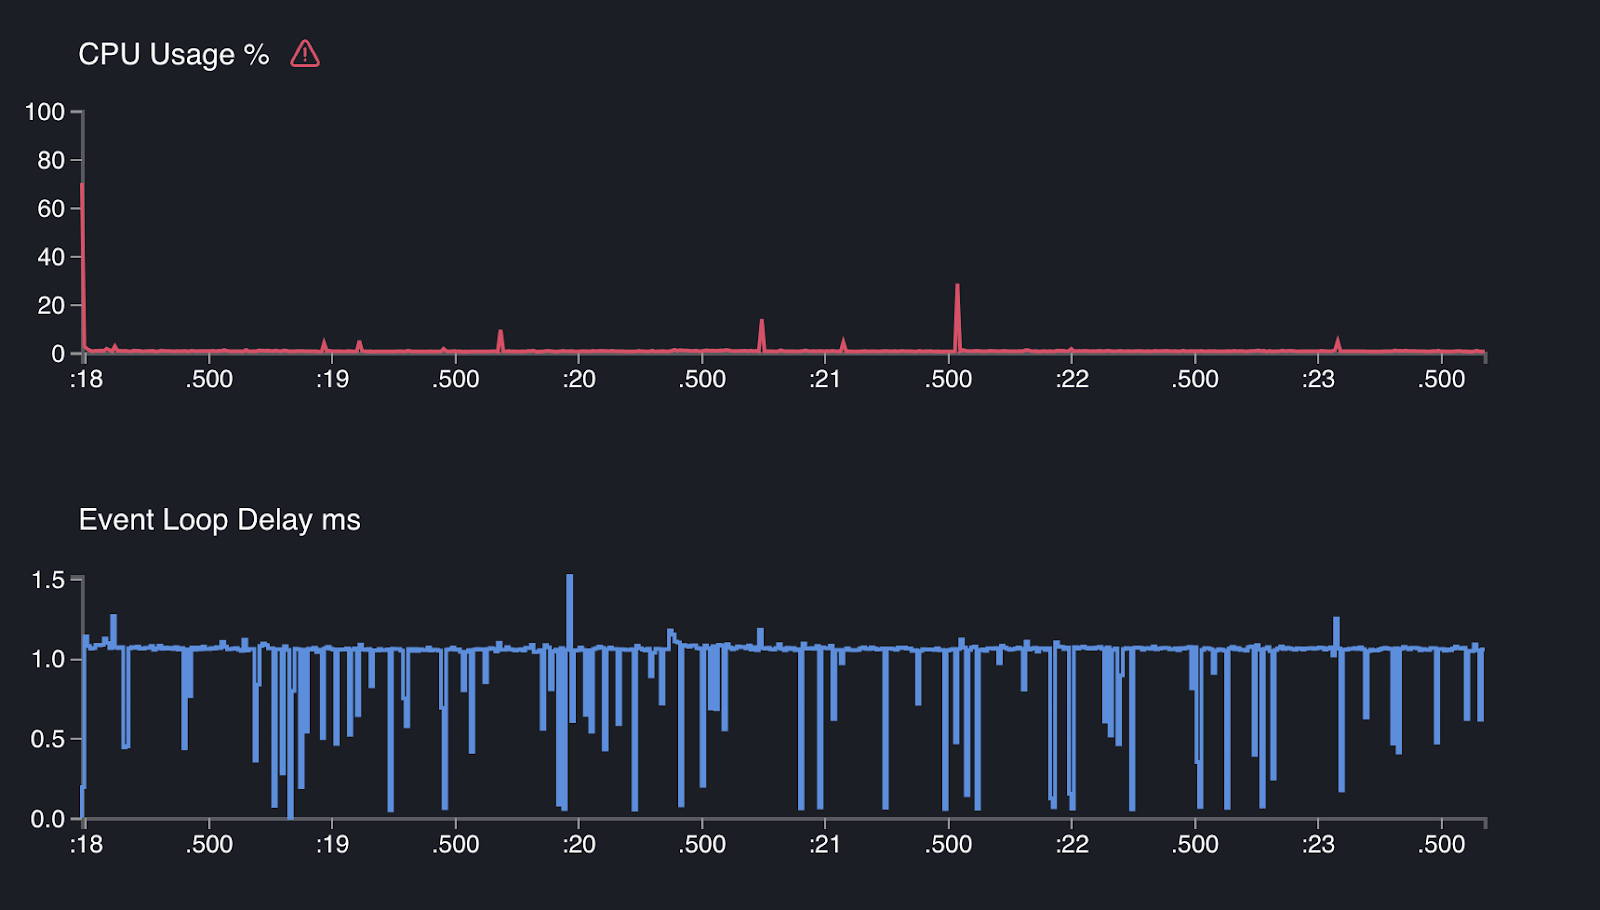
Let’s see what Doctor says.
The picture is not even close in terms of CPU usage and event loop delay.
Async endpoint
Next, let's look at the async endpoint. Here are both implementations of the endpoint:
Solution with async operations waterfall
function generateAsyncOperation() {
 return new Promise(resolve => {
   setTimeout(() => {

     // Simulate heavy async operation
     for (let i = 0; i < 50000000; i++) { }
     resolve();
   }, 1000);
 });
}

function runAsyncTask(cb) {
 await generateAsyncOperation();
 await generateAsyncOperation();
 await generateAsyncOperation();
 cb();
}
Solution without async operations waterfall
function generateAsyncOperation() {
 return new Promise(resolve => {
   setTimeout(() => {

     // Simulate heavy async operation
     for (let i = 0; i < 50000000; i++) { }
     resolve();
   }, 1000);
 });
}

async function runSmartAsyncTask(cb) {
 await Promise.all(new Array(3).fill()
   .map(() => generateAsyncOperation()));
 cb();
}
We’ll start profiling the async endpoint with Doctor.
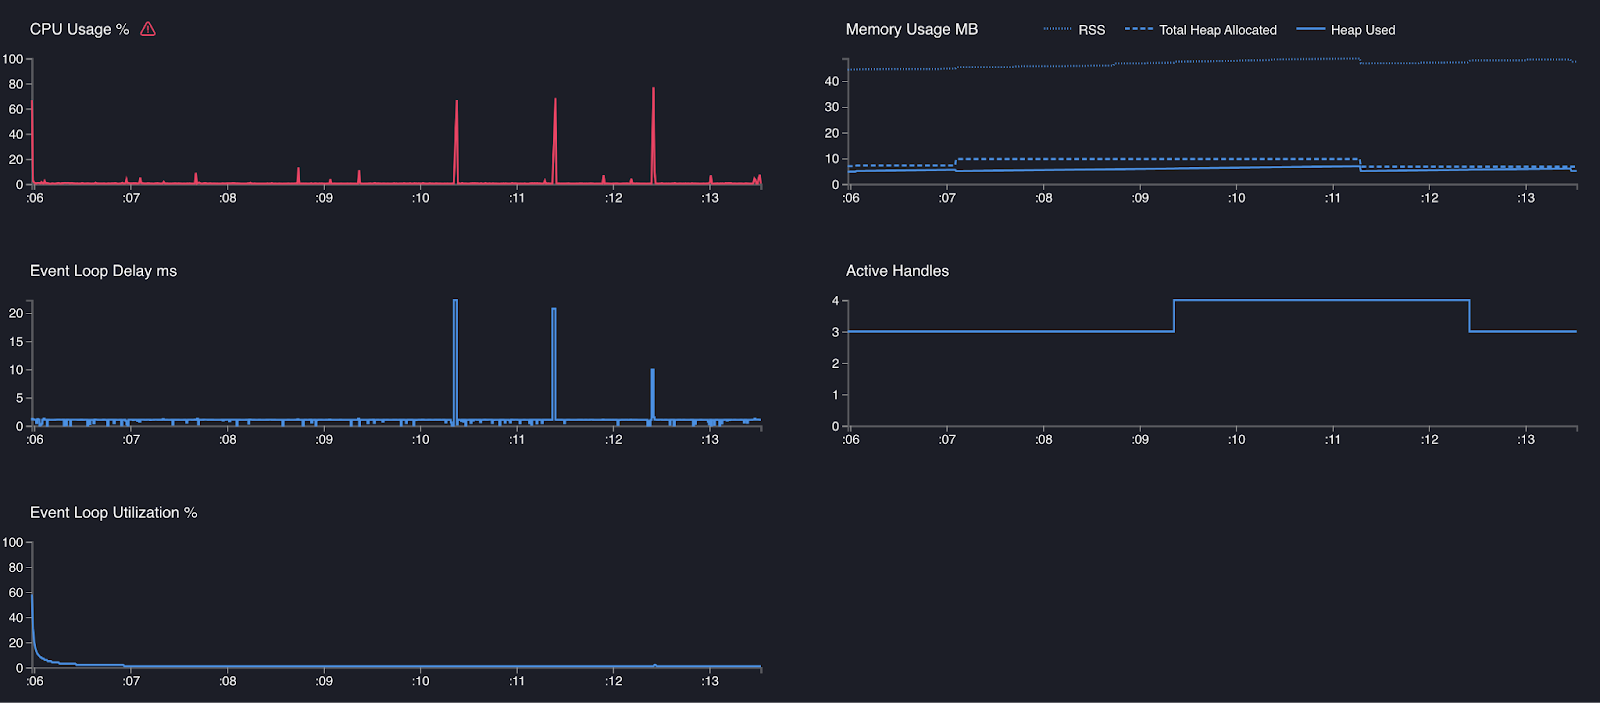
Although the graphs look fine, an error message suggests further investigation. Let’s delve into the details.

Doctor recommends using Bubbleproof to troubleshoot async issues further. Let’s follow that advice.
clinic bubbleproof – node app.js
Running the same async endpoint generates a report showing three consecutive operations. Each purple line represents an async operation, with additional details available for exploration.
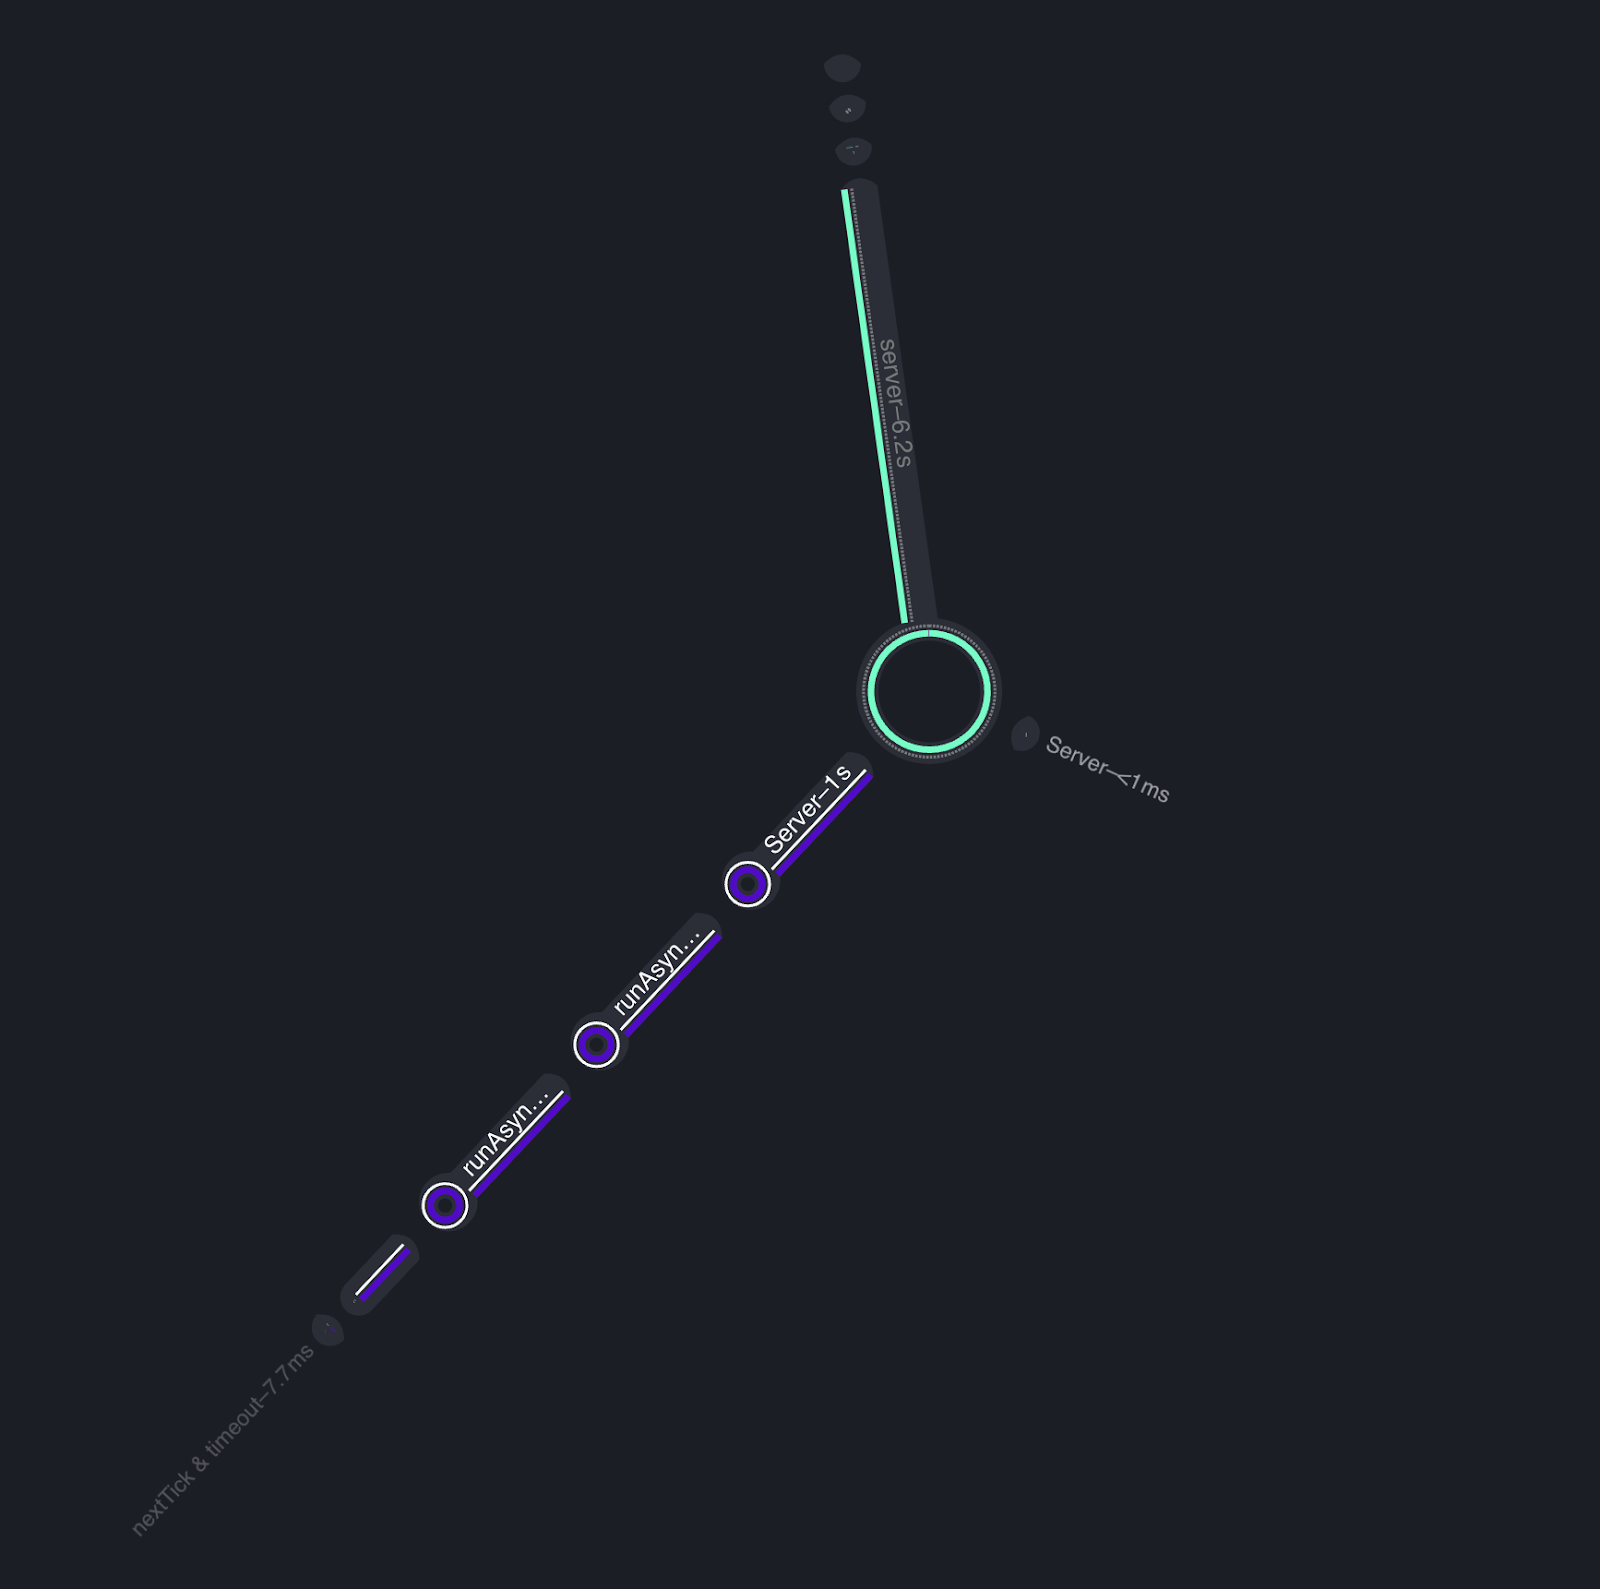
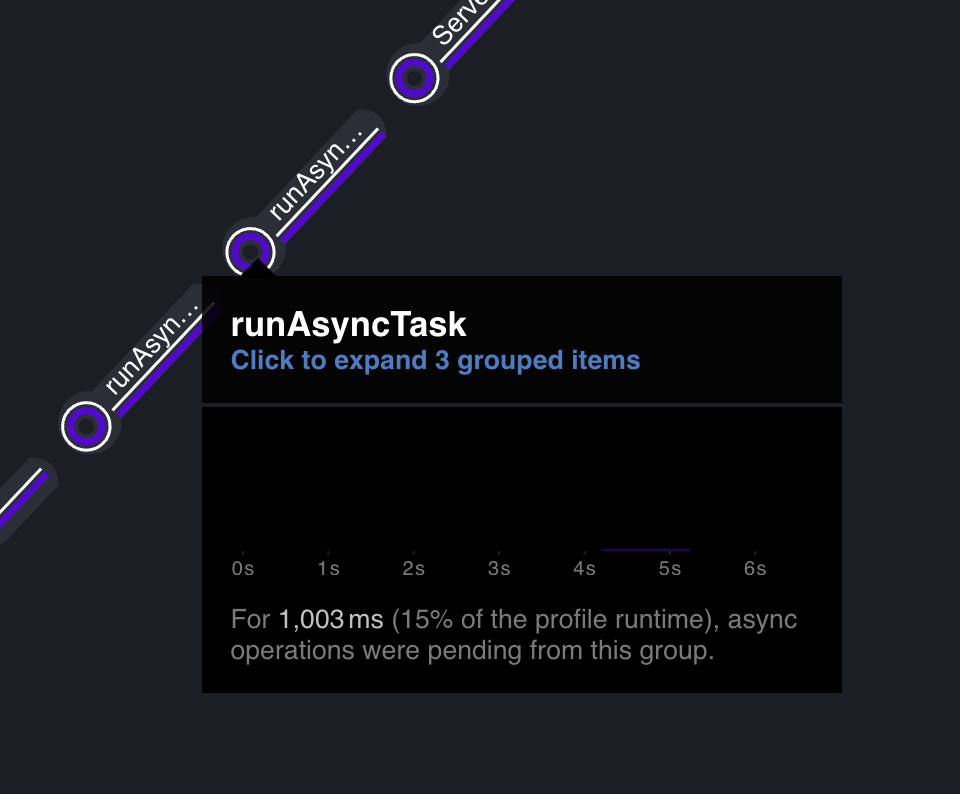
This visualization clearly illustrates the waterfall problem in async operations. Now, let's switch to the optimized route handler. We'll replace runAsyncTask with runSmartAsyncTask and rerun the workflow.
The new graph looks much better, showing only a single call to the async operation. This is exactly the result we want.
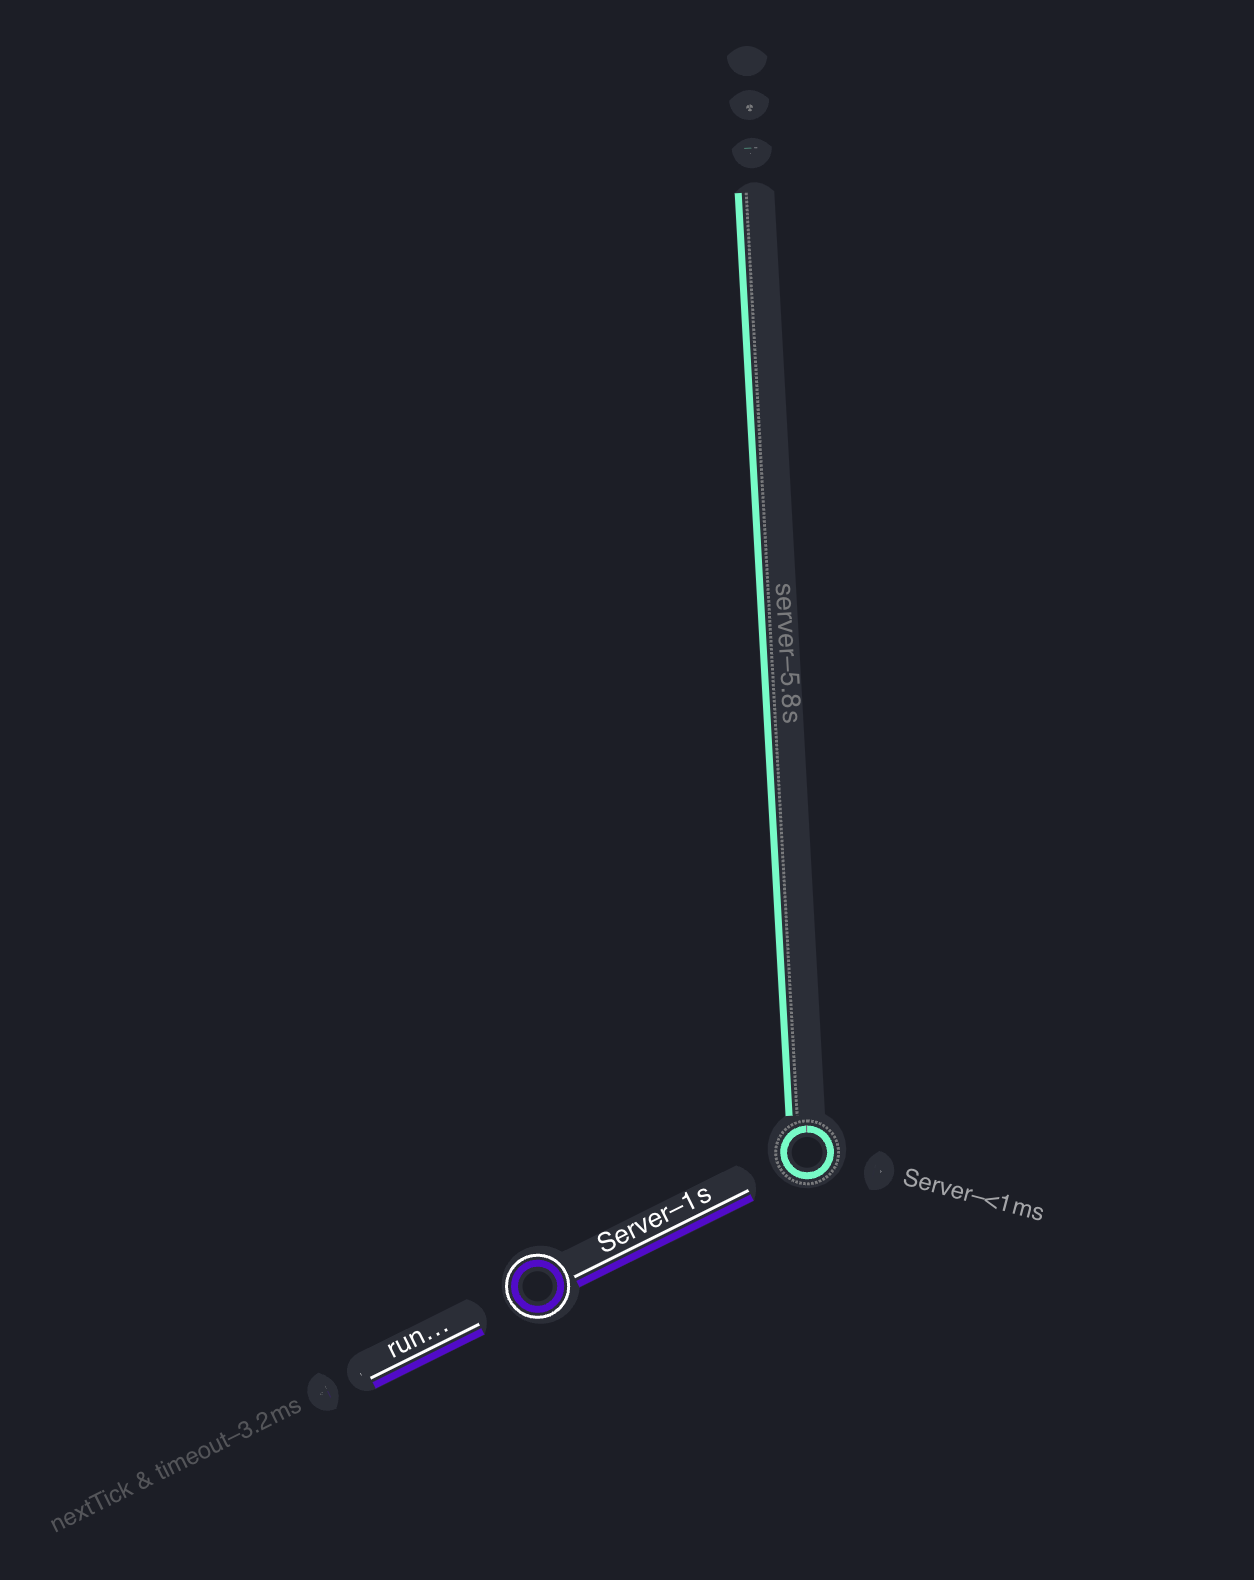
The optimized graph now contains only a single call to the async operation, eliminating the inefficiencies of the waterfall problem.
Memory leak endpoint
Here's the code for both scenarios:
Solution with memory leak
const memoryLeak = new Map();

function runMemoryLeakTask(cb) {
 for (let i = 0; i < 10000; i++) {
   const person = {
     name: `Person number ${i}`,
     age: i,
   };

   memoryLeak.set(person, `I am a person number ${i}`);
 }

 cb();
}
Solution without memory leak
const smartMemoryLeak = new WeakMap();

function runSmartMemoryLeakTask(cb) {
 for (let i = 0; i < 10000; i++) {
   const person = {
     name: `Person number ${i}`,
     age: i,
   };

   smartMemoryLeak.set(person, `I am a person number ${i}`);
 }

 cb();
}
In the first function, runMemoryLeakTask, we use a Map to store objects, which prevents them from being garbage collected, causing a memory leak.
In the second function, runSmartMemoryLeakTask, we use a WeakMap, which allows garbage collection of the keys when they are no longer referenced elsewhere.
We need a different approach for memory profiling because Clinic Doctor doesn’t provide enough information in this case. Instead, we’ll use the heap profiler right away.
Here’s how to run the heap profiler:
clinic heapprofiler – node app.js
After profiling the unoptimized memory leak endpoint, we see the following:
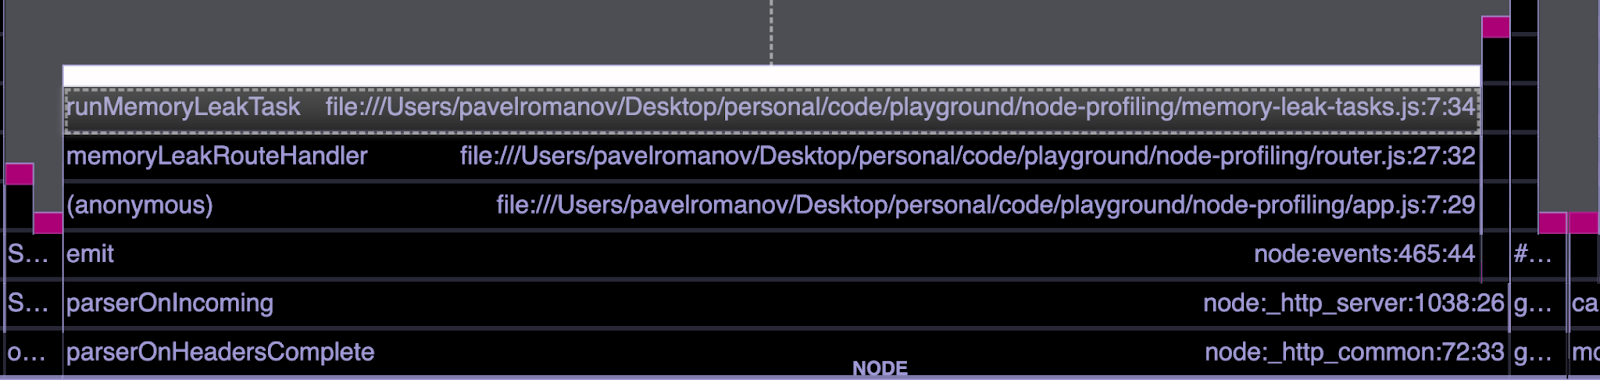
The function with a memory leak consumes more than half of the allocated memory. This is easy to spot due to the large space it occupies in the profiler.
Now, let’s run the optimized function and see the difference.
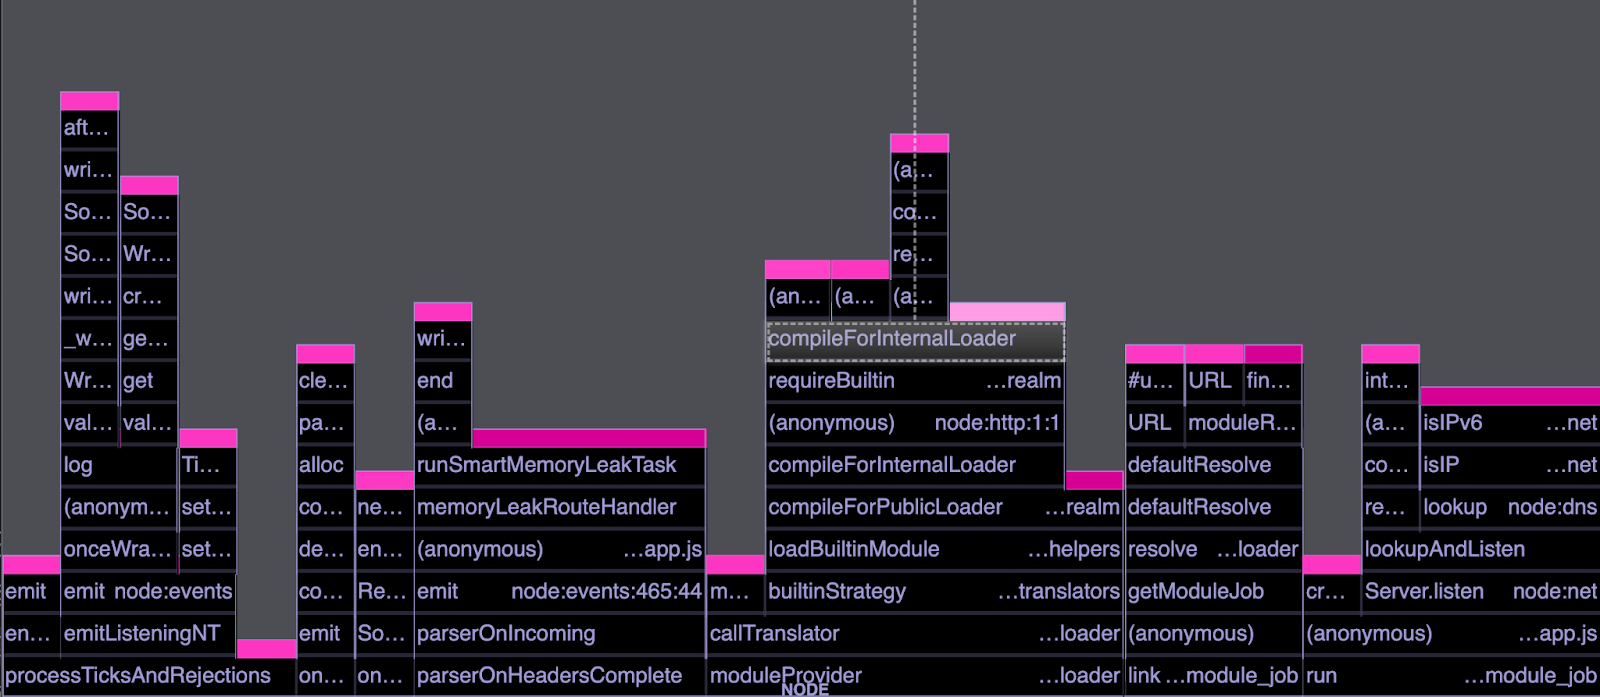
The result is clear: the memory leak has been resolved, as the large memory-consuming function is no longer present.
Conclusion
Clinic is a powerful tool for profiling Node.js applications, offering clear and human-readable diagnostics through Doctor.
Its dedicated tools for async, I/O, and memory profiling make it invaluable for addressing various performance issues. By using Clinic, you can efficiently identify and resolve problems, ensuring your applications run smoothly and effectively.